machine-learning-nanodegree
Class notes for the Machine Learning Nanodegree at Udacity
Go to IndexMean
Arithmetic Mean

Geometric Mean

Harmonic Mean

Mean of Probability Distribution


Mode
The mode of a sample is the element that occurs most often in the collection. For example, the mode of the sample [1, 3, 6, 6, 6, 6, 7, 7, 12, 12, 17] is 6.
Median

Standard Deviation and Variance
Variance
The variance of a random variable X is the expected value of the squared deviation from the mean of X:
Var(X) = E[(X - μ)²]
Usually the expected value for most distributions is the arithmetic mean:
Standard Deviation
Standard deviation is the square root of the variance.
Example
Example: The marks of a class of eight students (that is, a population) are the following eight values:
For example, the marks of a class of eight students (that is, a population) are the following eight values:

These eight data points have the mean (average) of 5:

First, calculate the deviations of each data point from the mean, and square the result of each:

The variance is the mean of these values:

and the population standard deviation is equal to the square root of the variance:

Normal Distribution
Probability Density

Bessels Correction
Sample standard deviation
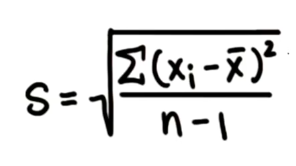
This is used to approximate standard deviation of the population, from a standar deviation of a sample.
Reference: Wikipedia